Market Outlook
May 14, 2018
Market Cues
Domestic Indices
Chg (%)
(Pts)
(Cl ose)
Indian markets are likely to open flat tracking global indices and SGX Nifty.
BSE Sensex
0.8
290
35,536
U.S. Stocks turned in a lackluster performance during trading on Friday. The major
Nifty
0.8
90
10,807
averages spent the day bouncing back and forth across the unchanged line. The
Mid Cap
0.4
65
16,344
Dow Jones was up by 0.4% to 24,831 and the Nasdaq ended flat to 7,403.
Small Cap
(0.1)
(21)
17,818
U.K. shares were little changed in lackluster the last trading session as the pound
Bankex
1.1
331
29,689
edged higher against major currencies and oil prices also dipped from recent highs
on expectations that alternative supplies could replace a looming drop in Iranian
Global Indices
Chg (%)
(Pts)
(Cl ose)
exports from U.S. sanctions. The benchmark FTSE 100 was marginally higher by
0.3% at 7,725.
Dow Jones
0.4
92
24,831
Nasdaq
(0.0)
(2)
7,403
On domestic front, Indian shares rallied on Friday, mirroring weak cues from
FTSE
0.3
24
7,725
global markets as tepid U.S. inflation data helped ease worries of faster U.S. interest
Nikkei
0.2
51
22,809
rate hikes this year and President Donald Trump said he had high hopes of "doing
something very meaningful" to curtail North Korea's nuclear ambitions at a summit
Hang Seng
1.4
442
31,564
in Singapore on June 12. The BSE Sensex closed higher by 0.8% at 35,536.
Shanghai Com
0.3
10
3,173
News Analysis
A dvances / Declines
BSE
NSE
Update in Target Price of GMM Pfaudler to '900
Advances
1,119
709
March IIP below estimates at 4.4% v/s 7.1% in February
Declines
1,560
1,083
Detailed analysis on Pg2
Unchanged
144
71
Investor’s Ready Reckoner
Volumes (` Cr)
Key Domestic & Global Indicators
BSE
3,281
Stock Watch: Latest investment recommendations on 150+ stocks
NSE
28,628
Refer Pg5 onwards
Top Picks
Net Inflows (` Cr)
Ne t
Mtd
Ytd
C MP
Target
U psi de
C ompany
Sector
R ating
(`)
(`)
(%)
FII
(171)
(3,115)
4,283
Blue Star
Capital Goods Accumulate
785
867
10.5
*MFs
660
4,004
49,757
Dewan Housi ng Finance
Financials
Buy
626
720
15.1
Century Plyboards
Forest Product
Buy
306
400
30.8
Top Gainers
Price (`)
Chg (%)
Navkar Corporation
Others
Buy
162
265
63.3
KEI Industrie s
Capital Goods Accumulate
439
485
10.5
MAHLIFE
519
11.2
More Top Picks on Pg4
SHARDACROP
427
8.8
WELSPUNIND
66
8.3
Key Upcoming Events
Previous
C onsensus
DEN
102
6.4
D ate
Region
Event Description
ReadingExpectations
ASIANPAINT
1,290
6.2
May 14, 2018 India
Industrial Production YoY
7.10
6.10
May 15, 2018 India
Monthly Wholesale Prices YoY%
2.47
2.90
Top Losers
Price (`)
Chg (%)
May 15, 2018 UK
Joble ss claims change
11.60
May 15, 2018 China
Industrial Production (YoY)
6.00
6.40
RAIN
275
-16.2
May 15, 2018 India
Imports YoY%
7.15
IDEA
51
-11.8
More Events on Pg7
IBVENTUREPP
314
-9.1
IBVENTURES
482
-6.9
BHARTIARTL
386
-6.4
As on May 11, 2018
Market Outlook
May 14, 2018
News Analysis
Update in Target Price of GMM Pfaudler to '900
GMM Pfaudler has given 16% returns since our coverage initiated on the stock,
last month. In view of continued traction in its user industries like Pharma and
Agrochemical, we are increasing our target price to ' 900 from '861 (Target
multiple of 21x on its FY2020 earnings).
March IIP below estimates at 4.4% v/s 7.1% in February
Industrial output grew by 4.4 per cent in March, the slowest in five months, due to
a fall in capital goods production and deceleration in mining activity. Industrial
growth measured by the Index of Industrial Production (IIP) in 2017-18 too
decelerated to 4.3 per cent from 4.6 per cent in the previous fiscal. The IIP grew by
4.4 per cent in March 2017, the same as in March this year.
Manufacturing sector, which constitutes over 77 per cent of the index, grew at 4.4
per cent in March as compared to 3.3 per cent in the same month a year ago. The
output of mining sector decelerated to 2.8 per cent during the month as compared
to 10.1 per cent in March 2017. However Consumer durables output on the other
hand showed an increase of 2.9 per cent as against decline of 0.6 per cent in
March 2017.
Economic and Political News
Banks are designing a scheme for bailing out stressed power assets
Corporate News
JSW Steel's April crude steel production up 6% at 1.36 million tonnes
Tata Motors global sales up 39% in April as commercial vehicle sales double
Reliance Jio's Rs 199 postpaid offer to hit Airtel, Idea's ARPU: Jefferies
Market Outlook
May 14, 2018
Quarterly Bloomberg Brokers Consensus Estimate
Hindustan Unilever Ltd - May 14, 2018
Particulars ( ` cr)
4QFY18E
4QFY17
y-o-y (%)
3QFY18
q-o-q (%)
Sales
8,516
8,213
3.6
8,590
(0.9)
EBIDTA
1,922
1,646
16.7
1,653
16.2
%
22.5
20.1
19.3
PAT
1,417
1,183
19.8
1,326
6.8
Market Outlook
May 14, 2018
Top Picks
Market Cap
C MP
Target
Upside
C ompany
R ationale
(` Cr)
(`)
(`)
(%)
Strong growth in domestic business due to its
leadership in acute therapeutic segment. Alkem
Alkem Laboratories
23,854
1,995
2,441
22.3
expects to launch more products in USA, which
bode s for its internati onal business.
Favorable outlook for the AC industry to augur well
for Cooling products business which is out pacing
Blue Star
7,534
785
867
10.5
the market growth. EMPPAC division's profitability
to improve once oper ating environme nt turns
around.
With a focus on the low and me dium income (LMI)
consumer se gment, the company has increase d its
Dewan Housi ng Finance
19,622
626
720
15.1
presence in tier-II & III cities where the growth
opportunity i s immense.
Well capitalized with CAR of 18.1% which give s
sufficient room to grow asset base. F aster re solution
ICICI Bank
1,99,999
311
416
33.7
of NPA would reduce provi sion cost, which would
help to re port better ROE.
High order book execution in EPC segment, rising
KEI Industrie s
3,439
439
485
10.5
B2C sales and hi gher exports to boost the revenue s
and profitability
Expected to benefit from the lower capex
Music Broadcast Limited
2,085
366
475
30.0
requirement and 15 year long radio broadcast
licensing.
Massive capacity expansion along with rail
Navkar Corporation
2,443
162
265
63.3
advantage at ICD as well CFS augur well for the
company
Strong brands and distribution network would boost
Siyaram Silk Mills
3,071
655
851
29.9
growth goi ng ahe ad. Stock currently trades at an
inexpensive valuation.
Market leadership in Hindi news genre and no. 2
viewership ranking in English news genre, exit from
TV Today Network
2,567
430
603
40.1
the radio busine ss, and anticipated growth in ad
spends by corporate to benefit the stock.
GST regime and the Gujarat plant are expected to
Maruti
2,63,967
8,738
10,619
21.5
improve the company’s sales volume and margins,
respectively.
We expect loan book to grow at 24.3% over next
GIC Housing
2,173
403
655
62.3
two year; change in borrowing mix will help in NIM
improve ment
We expect CPIL to report net Revenue/PAT CAGR of
~17%/ 16% over FY2017-20E mainly due to
Century Plyboards
6,794
306
400
30.8
healthy growth in plywood & lamination busine ss,
forayed into MDF & Particle boards on back of
strong brand & distribution network.
We expect sales/PAT to grow at 13.5%/ 20% over
LT Foods
2,795
87
128
46.5
next two years on the back of strong di stribution
network & addition of new products in portfolio.
Third large st brand play in luggage segment
Increase d product offerings and improvi ng
Safari Industries
1,387
623
750
20.3
distribution network is leading to strong growth in
busine ss. Likely to post robust growth for next 3-4
years
We expect HSIL to report PAT CAGR of ~15% over
FY2017-20E owing to better improve ment in
HSIL Ltd
2,794
386
510
32.0
operating margi n due price hi ke in container glass
segment, turnaround in consumer busine ss.
Source: Company, Angel Research
Market Outlook
May 14, 2018
Top Picks
Market Cap
C MP
Target
Upside
C ompany
R ationale
(` Cr)
(`)
(`)
(%)
We expect financialisation of savings and
Aditya Birla Capital
33,324
151
218
44.0
increasing penetration in Insurance & Mutual fund
would ensure steady growth.
One of the leading Indian dairy products
companie s in India created strong brands in dairy
products. Rising revenue share of high-margin
Parag Milk F oods
2,596
309
333
7.9
Value Adde d Products and reducti on in interest cost
is likely to boost margins and e arnings in next few
years.
We expect MCL to report net revenue CAGR of
~15% to ~` 450cr over FY2018-20E mainly due to
strong growth in online matchmaking & marriage
Matrimony.com Ltd
1,840
810
1,016
25.4
related services. On the bottom-line front, we
expect a CAGR of ~28% to `82cr over the same
period on the back margin improve ment.
HDFC Bank maintaine d its steady growth in the
4QFY18. The bank’s net profit grew by
20.3%.
Steady growth in interest income and other income
HDFC Bank
5,22,161
2,011
2,315
15.1
aided PAT growth. The Strong liability franchise
and he althy capitalisation provi des strong earning
visibility. At the current market price, the bank is
trading at 3.2x FY20E ABV.
We expect strong PAT growth on back of healthy
growth in automobile segment (on back of new
launche s and facelifts in some of the model ) and
M&M
1,06,921
869
990
13.9
strong growth in Tractors segment coupled by its
strong brand recall and i mprovement in rural
sentiment
Source: Company, Angel Research
Market Outlook
May 14, 2018
Fundamental Call
Market Cap
C MP
Target
Upside
C ompany
R ationale
(` Cr)
(`)
(`)
(%)
CCL is likely to maintain the strong growth trajectory
CCL Products
4,029
303
360
18.9
over FY18-20 backed by capacity expansion and
new geographical foray
We forecast Nilkamal to report top-line CAGR of
~9% to `2,635cr over FY17-20E on the back of
Nilkamal
2,508
1,681
2,178
29.6
healthy demand growth in plastic divi sion. On the
bottom-line front, we esti mate
~10% CAGR to
`162cr owing to improve ment in volumes.
Elantas Beck India is the Indian market leader in
liquid insulation segment used in electrical
equipme nts like motors, transformers etc. It derives
Elantas Beck India Ltd
1,673
2,110
2,500
18.5
demand from several industries which are expected
to register 10%+ CAGR in demand in the coming
years.
Greenply Industries Ltd (GIL) manufactures plywood
& allied products and me dium density fibreboards
(MDF). GIL to report net revenue CAGR of ~14% to
Greenply Industries
3,680
300
395
31.6
~`2,478cr over FY2017-20E mainly due to healthy
growth in plyw ood & lamination busine ss on the
back of strong brand and di stribution network
GMM Pfaudler Limited (GMM) is the Indian market
leader in glass-lined (GL) steel equipment. GMM is
expected to cross CAGR 15%+ in revenue over the
GMM Pfaudler Ltd
1,206
825
900
9.1
next few years mainly led by uptick in demand from
user industries and it is also expecting to increase its
share of non-GL business to 50% by 2020.
L&T Fin’s new manage ment is on track to achieve
L&T Finance Hol ding
35,564
178
210
17.8
ROE of 18% by 2020 and recent capital infusion of
`3000cr would support advance growth.
Market Outlook
May 14, 2018
Key Upcoming Events
Result Calendar
D ate
C ompany
May 14, 2018
Blue Star, S outh Ind.Bank, HUL
May 15, 2018
KEC International , Mangalam Ce ment, Punjab Natl.Bank, Syndicate Bank, Britannia, Electrosteel Castings, Lupin
Source: Bloomberg, Angel Research
Global economic events release calendar
Bl oomberg Data
D ate
Time
C ountry
Event Description
Unit
Period
L ast Reporte d
E stimate d
May 14, 2018
5:30 PMIndia
Industrial Production YoY
% Change
Mar
7.10
6.10
May 15, 2018
12: 00 PMIndia
Monthly Wholesale Prices YoY%
% Change
Apr
2.47
2.90
2:00 PMUK
Joble ss claims change
% Change
Apr
11.60
7:30 AMChina
Industrial Production (YoY)
% Change
Apr
6.00
6.40
India
Imports YoY%
% Change
Apr
7.15
India
Exports YoY%
% Change
Apr
(0.66)
11: 30 AMGermany GDP nsa (YoY)
% Change
1Q P
2.30
May 16, 2018
2:30 PMEuro Zone Euro-Zone CPI (YoY)
%
Apr F
1.20
6:45 PMUS
Industrial Production
%
Apr
0.51
0.55
6:00 PMUS
Housi ng Starts
Thousands
Apr
1,319.00
1,319.00
6:00 PMUS
Building permits
Thousands
Apr
1,379.00
1,343.00
May 23, 2018
1:00 PMGermany PMI Manufacturing
Value
May P
58.10
1:00 PMGermany PMI Services
Value
May P
53.00
7:30 PMEuro Zone Euro-Zone Consumer Confidence
Value
May A
0.40
7:30 PMUS
New home sales
Thousands
Apr
694.00
670.00
Source: Bloomberg, Angel Research
Market Outlook
May 14, 2018
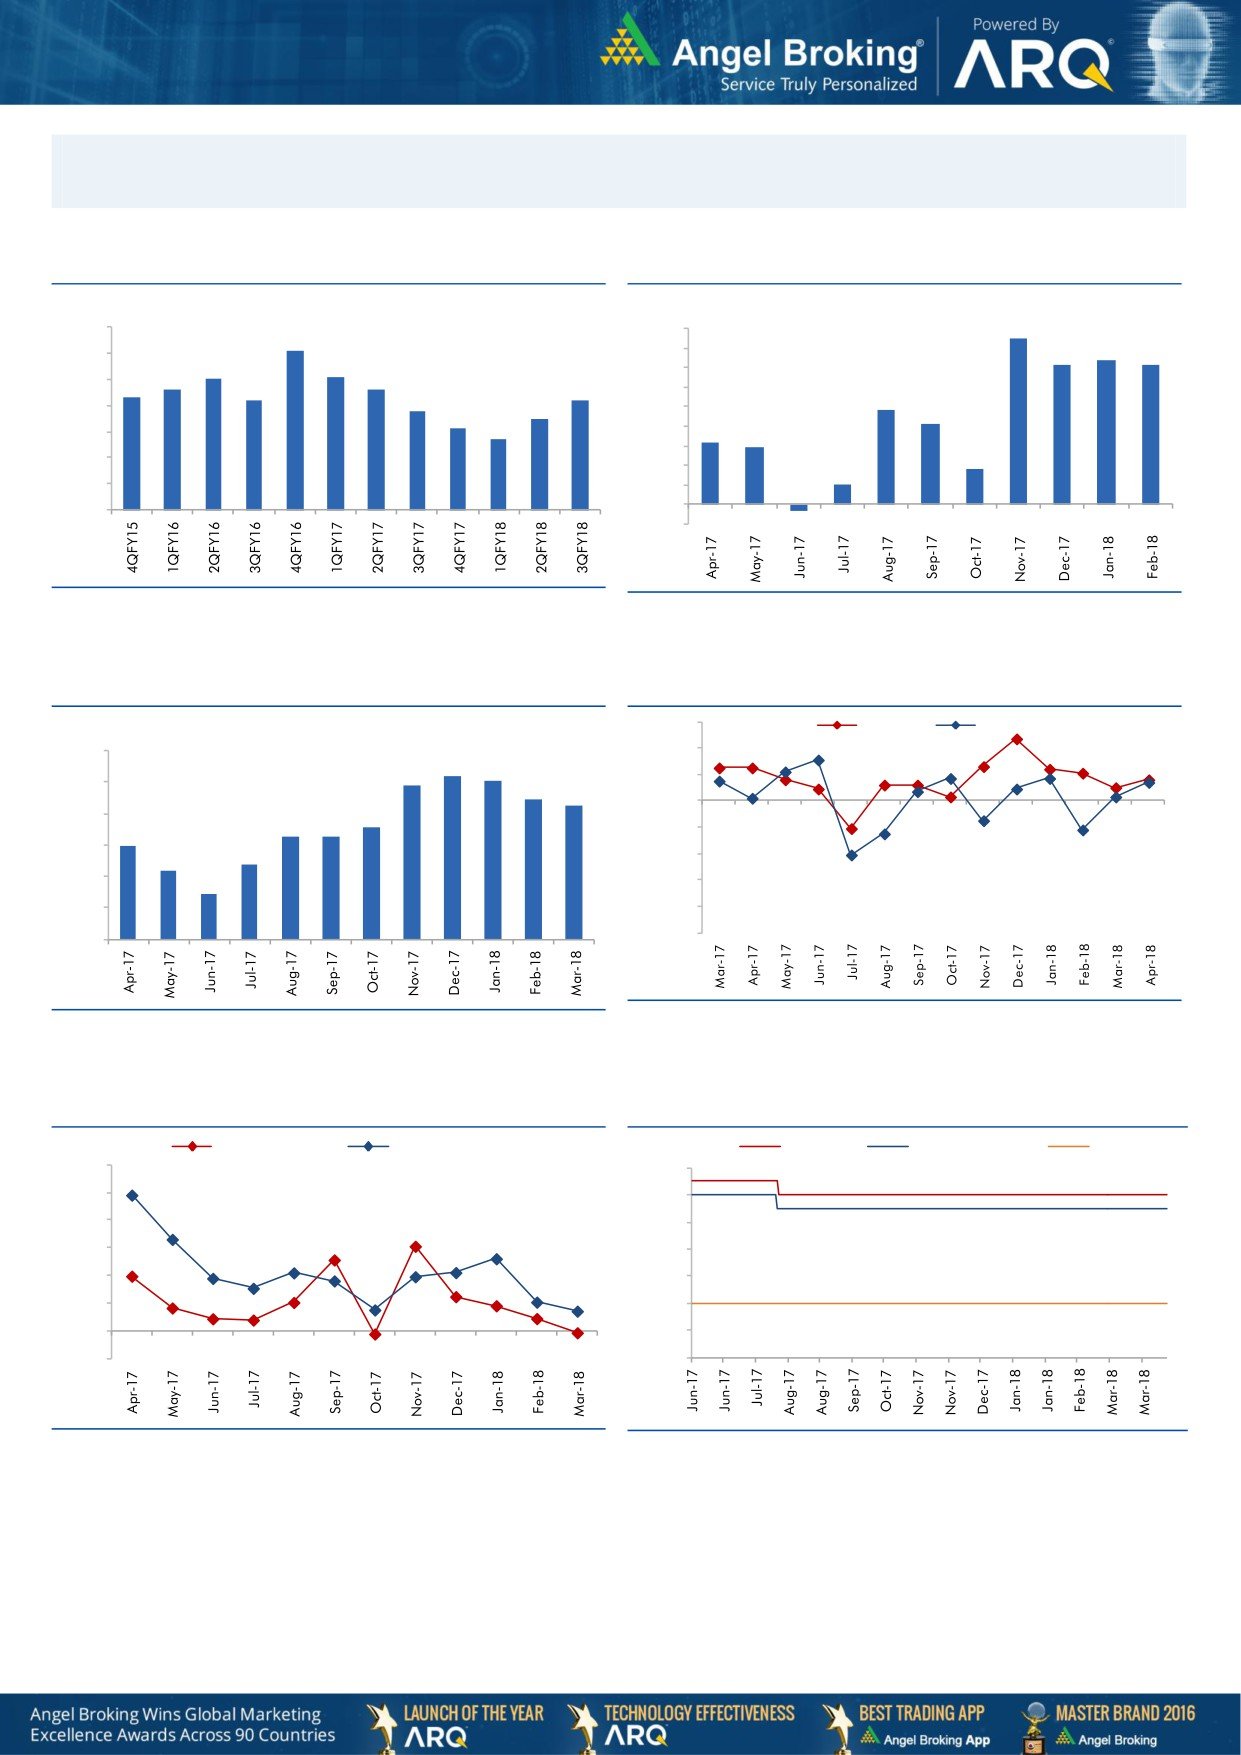
Macro watch
Exhibit 1: Quarterly GDP trends
Exhibit 2: IIP trends
(%)
(%)
8.5
10.0
9.0
9.1
7.4
9.0
8.0
7.1
7.1
8.0
8.1
7.0
7.6
7.6
8.0
7.3
7.2
7.2
6.0
6.8
4.8
7.0
6.5
5.0
4.1
6.1
5.7
4.0
3.2
6.0
2.9
3.0
1.8
5.0
2.0
1.0
4.0
1.0
-
3.0
(1.0)
(0.3)
Source: CSO, Angel Research
Source: MOSPI, Angel Research
Exhibit 3: Monthly CPI inflation trends
Exhibit 4: Manufacturing and services PMI
56.0
Mfg. PMI
Services PMI
(%)
6.0
54.0
5.2
5.1
4.9
52.0
5.0
4.4
4.3
50.0
4.0
3.6
3.3
3.3
3.0
48.0
3.0
2.4
2.2
46.0
2.0
1.5
44.0
1.0
42.0
40.0
-
Source: Market, Angel Research; Note: Level above 50 indicates expansion
Source: MOSPI, Angel Research
Exhibit 5: Exports and imports growth trends
Exhibit 6: Key policy rates
(%)
Exports yoy growth
Imports yoy growth
(%)
Repo rate
Reverse Repo rate
CRR
60.0
6.50
50.0
6.00
40.0
5.50
30.0
5.00
20.0
4.50
10.0
4.00
0.0
3.50
(10.0)
3.00
Source: Bloomberg, Angel Research
Source: RBI, Angel Research
Market Outlook
May 14, 2018
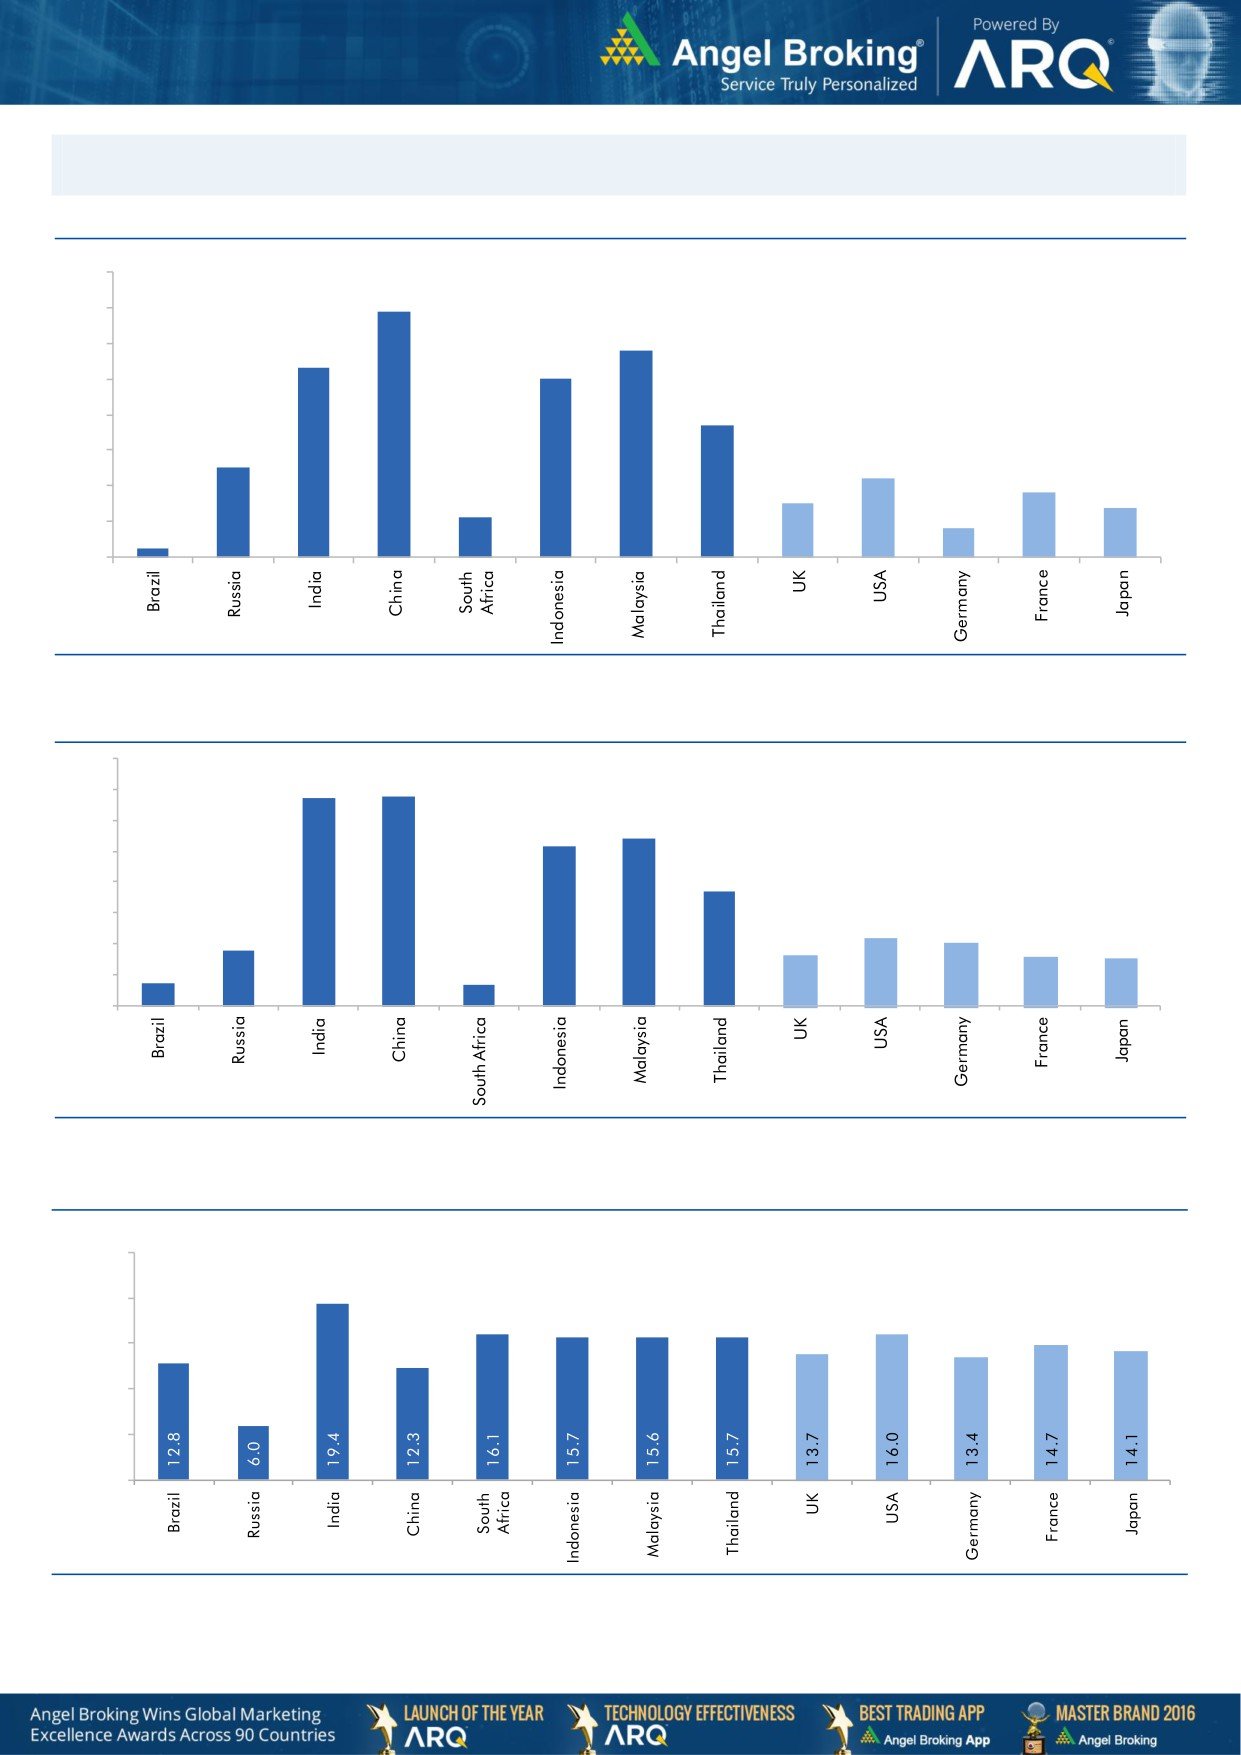
Global watch
Exhibit 1: Latest quarterly GDP Growth (%, yoy) across select developing and developed countries
(%)
8.0
6.9
7.0
5.8
6.0
5.3
5.0
5.0
1.1
3.7
4.0
2.5
3.0
2.2
1.8
2.0
1.5
1.4
0.8
1.0
0.3
-
Source: Bloomberg, Angel Research
Exhibit 2: 2017 GDP Growth projection by IMF (%, yoy) across select developing and developed countries
(%)
6.7
6.8
7.0
6.0
5.4
5.2
5.0
3.7
4.0
3.0
1.8
2.2
2.0
1.7
1.6
2.0
0.7
1.5
0.7
1.0
-
Source: IMF, Angel Research
Exhibit 3: One year forward P-E ratio across select developing and developed countries
(x)
25.0
20.0
15.0
10.0
5.0
-
Source: IMF, Angel Research
Market Outlook
May 14, 2018
Exhibit 4: Relative performance of indices across globe
Returns (%)
C ountry
Name of index
Closing price
1M
3M
1YR
Brazil
Bovespa
85,220
0.8
1.6
29.7
Russia
Micex
4,556
1.4
7.1
11.4
India
Nifty
10,807
3.9
1.3
16.0
China
Shanghai Composite
3,163
(0.5)
(8.8)
1.3
South Africa
Top 40
51,823
4.9
2.6
8.8
Mexico
Mexbol
46,729
(3.3)
(5.2)
(5.7)
Indonesia
LQ45
962
(8.9)
(14.0)
0.1
Malaysia
KLCI
1,847
0.6
(0.4)
4.4
Thailand
SET 50
1,168
1.8
(0.6)
17.6
USA
Dow Jones
24,831
2.7
4.1
18.8
UK
FTSE
7,725
5.1
1.6
2.4
Japan
Nikkei
22,758
5.7
(2.6)
16.7
Germany
DAX
13,001
4.9
3.3
1.8
France
CAC
5,542
4.4
5.4
4.2
Source: Bloomberg, Angel Research 68in4
Market Outlook
May 14, 2018
Exhibit 7: Historical Angel Top Picks/Fundamental Calls
D ate Added
Top Picks/Fundamental
Stocks
Reco Price
Target/Revised Price
Curre nt Status
04-05-2018
Top Picks
M&M
860
990
Open
03-05-2018
Fundamental
L&T Finance Hol ding
171
210
Open
02-05-2018
Top Picks
HDFC Bank
1944
2315
Open
04-05-2018
Top Picks
Matrimony.com Ltd
810
1016
Open
20-04-2018
Top Picks
Matrimony.com Ltd
781
984
16-04-2018
Top Picks
Parag Milk F oods Limited
249
333
Open
14-05-2018
Fundamental
GMM Pfaudler Limited
818
900
Open
06-04-2018
Fundamental
GMM Pfaudler Limited
712
861
07-03-2018
Fundamental
Ashok Leyland Ltd
139
163
Closed (26/ 04/ 2018)
03-03-2018
Fundamental
Greenply Industries
340
395
Open
16-04-2018
Top Picks
Safari Industries
651
750
Open
21-02-2018
Top Picks
Safari Industries
532
650
16-02-2018
Top Picks
HSIL Ltd
433
510
Open
07-02-2018
Fundamental
Elantas Beck India Ltd.
2155
2500
Open
01-02-2018
Top Picks
ICICI Bank
352
416
Open
01-02-2018
Top Picks
Aditya Birla Capital
167
218
Open
04-01-2018
Fundamental
CCL Products
278
360
Open
03-01-2018
Fundamental
Nilkamal Ltd
1880
2178
Open
01-01-2018
Fundamental
Capital First Ltd
693
850
Closed (15/ 01/ 2018)
30-12-2017
Fundamental
Shreyans Industries Ltd
205
247
Closed
Fundamental
Prism Cement Ltd
160
Closed (09/ 05/ 2018)
21-12-2017
Fundamental
Prism Cement Ltd
118
131
18-12-2017
Fundamental
Menon Bearings Limited
92
114
Closed (17/ 01/ 2018)
14-12-2017
Top Picks
Ruchira Papers Ltd.
188
244
Closed (09/ 02/ 2018)
28-11-2017
Top Picks
Century Plyboards India
317
400
Open
19-12-2017
Top Picks
LT Foods
85
128
Open
06-11-2017
Top Picks
LT Foods
74
96
16-10-2017
Fundamental
Endurance Technologie s Ltd
1111
1277
Closed (01/ 12/ 2017)
11-09-2017
Top Picks
GIC Housing
533
655
Open
10-10-2017
Top Picks
Music Broadcast Limited
404
475
Open
20-07-2017
Top Picks
Music Broadcast Limited
368
434
07-07-2017
Fundamental
L&T Finance Hol dings Ltd
149
179
Closed (28/ 8/2017)
06-07-2017
Fundamental
Syngene International
478
564
Closed (1/3/2018)
05-07-2017
Top Picks
Maruti
7371
10619
Open
04-01-2017
Top Picks
KEI Industrie s
125
485
Open
01-12-2016
Top Picks
Alkem Lab
1700
2441
Open
04-08-2016
Top Picks
TV Today Network
297
603
Open
05-04-2016
Top Picks
DHFL
189
720
Open
05-01-2016
Top Picks
Navkar Corporation
207
265
Open
08-12-2015
Top Picks
Blue Star
357
867
Open
30-10-2015
Top Picks
Siyaram Silk Mills
186
851
Open
Source: Company, Angel Research
Market Outlook
May 14, 2018
Research Team Tel: 022 - 39357800
DISCLAIMER
Angel Broking Private Limited (hereinafter referred to as “Angel”) is a registered Member of National Stock Exchange of India
Limited,Bombay Stock Exchange Limited and Metropolitan Stock Exchange Limited. It is also registered as a Depository Particip ant with
CDSL and Portfolio Manager with SEBI. It also has registration with AMFI as a Mutual Fund Distributor. Angel Broking Private Limited is
a registered entity with SEBI for Research Analyst in terms of SEBI (Research Analyst) Regulations, 2014 vide registration number
INH000000164. Angel or its associates has not been debarred/ suspended by SEBI or any other regulatory authority for accessin g
/dealing in securities Market. Angel or its associates/analyst has not received any compensation / managed or co -managed public
offering of securities of the company covered by Analyst during the past twelve months.
This document is solely for the personal information of the recipient, and must not be singularly used as the basis of any in vestment
decision. Nothing in this document should be construed as investment or financial advice. Each recipient of this document should
make such investigations as they deem necessary to arrive at an independent evaluation of an investment in the securities of the
companies referred to in this document (including the merits and risks involved), and should consult their own advisors to determine
the merits and risks of such an investment.
Reports based on technical and derivative analysis center on studying charts of a stock's price mo vement, outstanding positions and
trading volume, as opposed to focusing on a company's fundamentals and, as such, may not match with a report on a company's
fundamentals. Investors are advised to refer the Fundamental and Technical Research Reports availa ble on our website to evaluate the
contrary view, if any.
The information in this document has been printed on the basis of publicly available information, internal data and other rel iable
sources believed to be true, but we do not represent that it is accurate or complete and it should not be relied on as such, as this
document is for general guidance only. Angel Broking Pvt. Limited or any of its affiliates/ group companies shall not be in any way
responsible for any loss or damage that may arise to any person from any inadvertent error in the information contained in this report.
Angel Broking Pvt. Limited has not independently verified all the information contained within this document. Accordingly, we cannot
testify, nor make any representation or warranty, express or implied, to the accuracy, contents or data contained within this document.
While Angel Broking Pvt. Limited endeavors to update on a reasonable basis the information discussed in this material, there may be
regulatory, compliance, or other reasons that prevent us from doing so.
This document is being supplied to you solely for your information, and its contents, information or data may not be reproduc ed,
redistributed or passed on, directly or indirectly.
Neither Angel Broking Pvt. Limited, nor its directors, employees or affiliates shall be liable for any loss or damage that may arise from
or in connection with the use of this information.